
The R Project for Statistical Computing
R is a language and environment for statistical computing and graphics. It provides a wide variety of statistical and graphical techniques, and is highly extensible. R can also be considered an integrated suite of software facilities for data manipulation, calculation, and graphical display. It includes
- An effective data handling and storage facility
- A suite of operators for calculations on arrays, in particular matrices
- A large, coherent, integrated collection of intermediate tools for data analysis
- Graphical facilities for data analysis and display, either on-screen or on hardcopy
- A well-developed, simple, and effective programming language that includes conditionals, loops, user-defined recursive functions and input and output facilities.
One of R’s strengths is the ease with which well-designed, publication-quality plots can be produced, including mathematical symbols and formulae where needed. Great care has been taken over the defaults for the minor design choices in graphics, but the user retains full control.
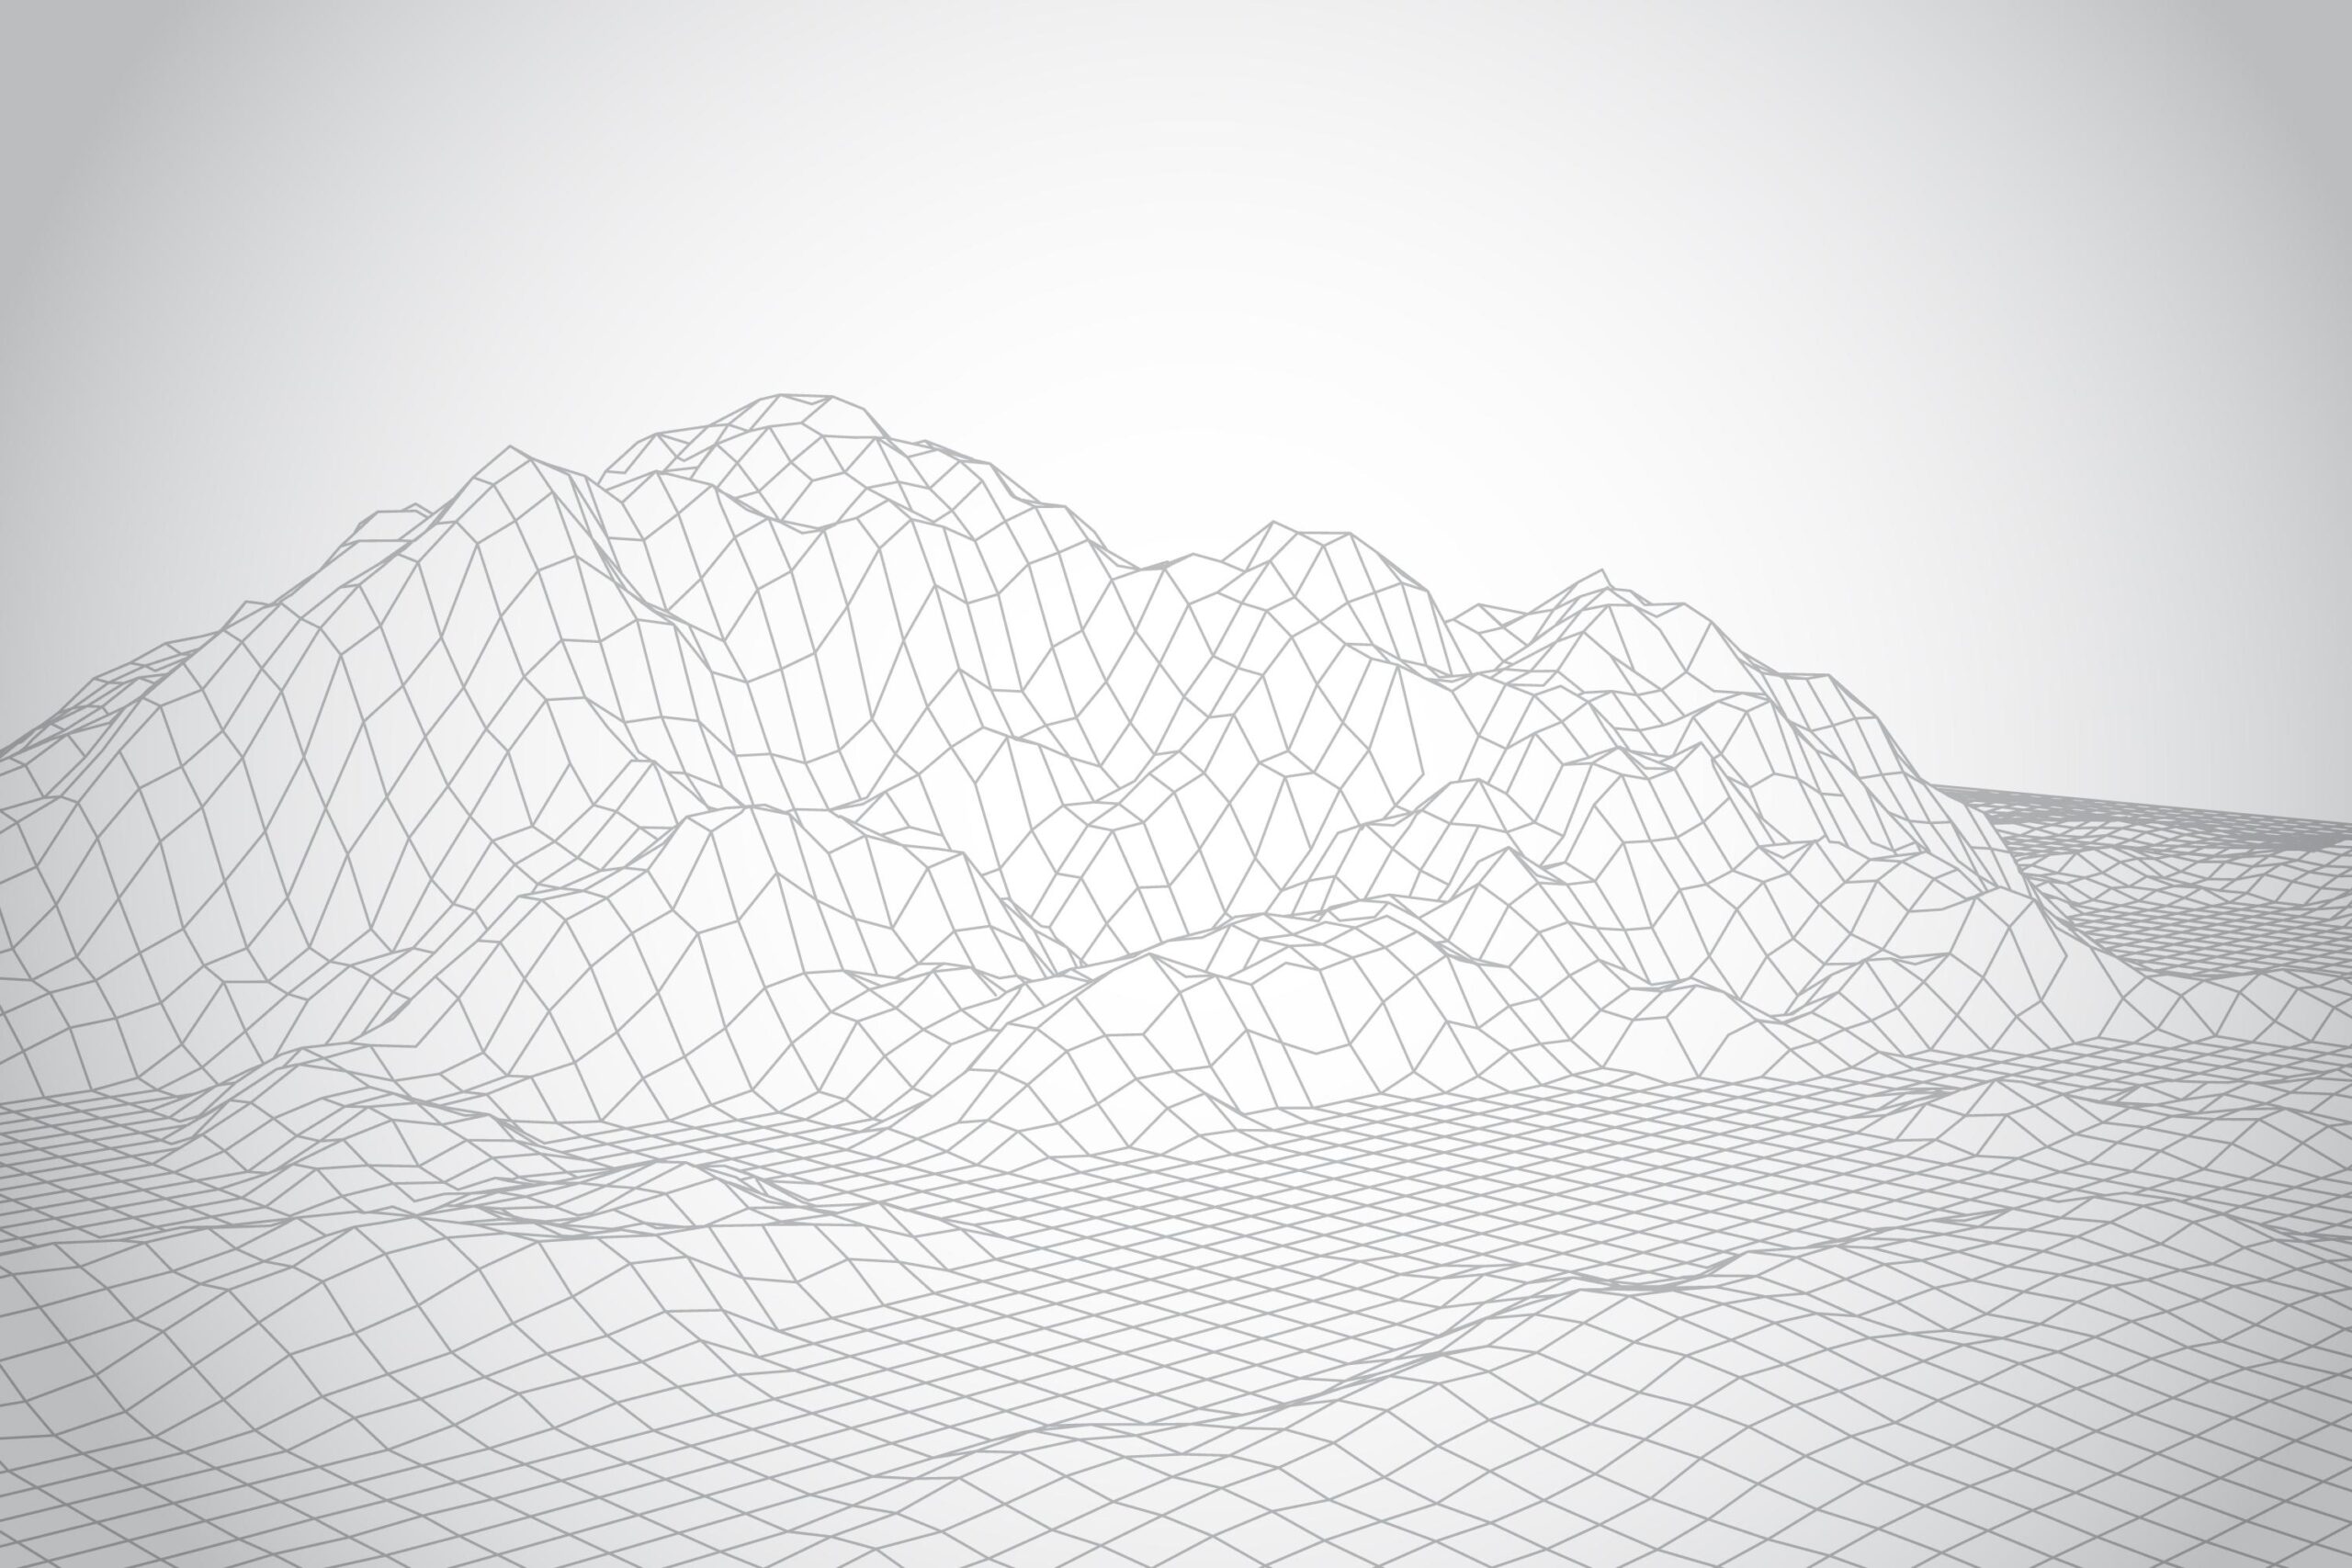
At Digital Landscape Solutions R is used for
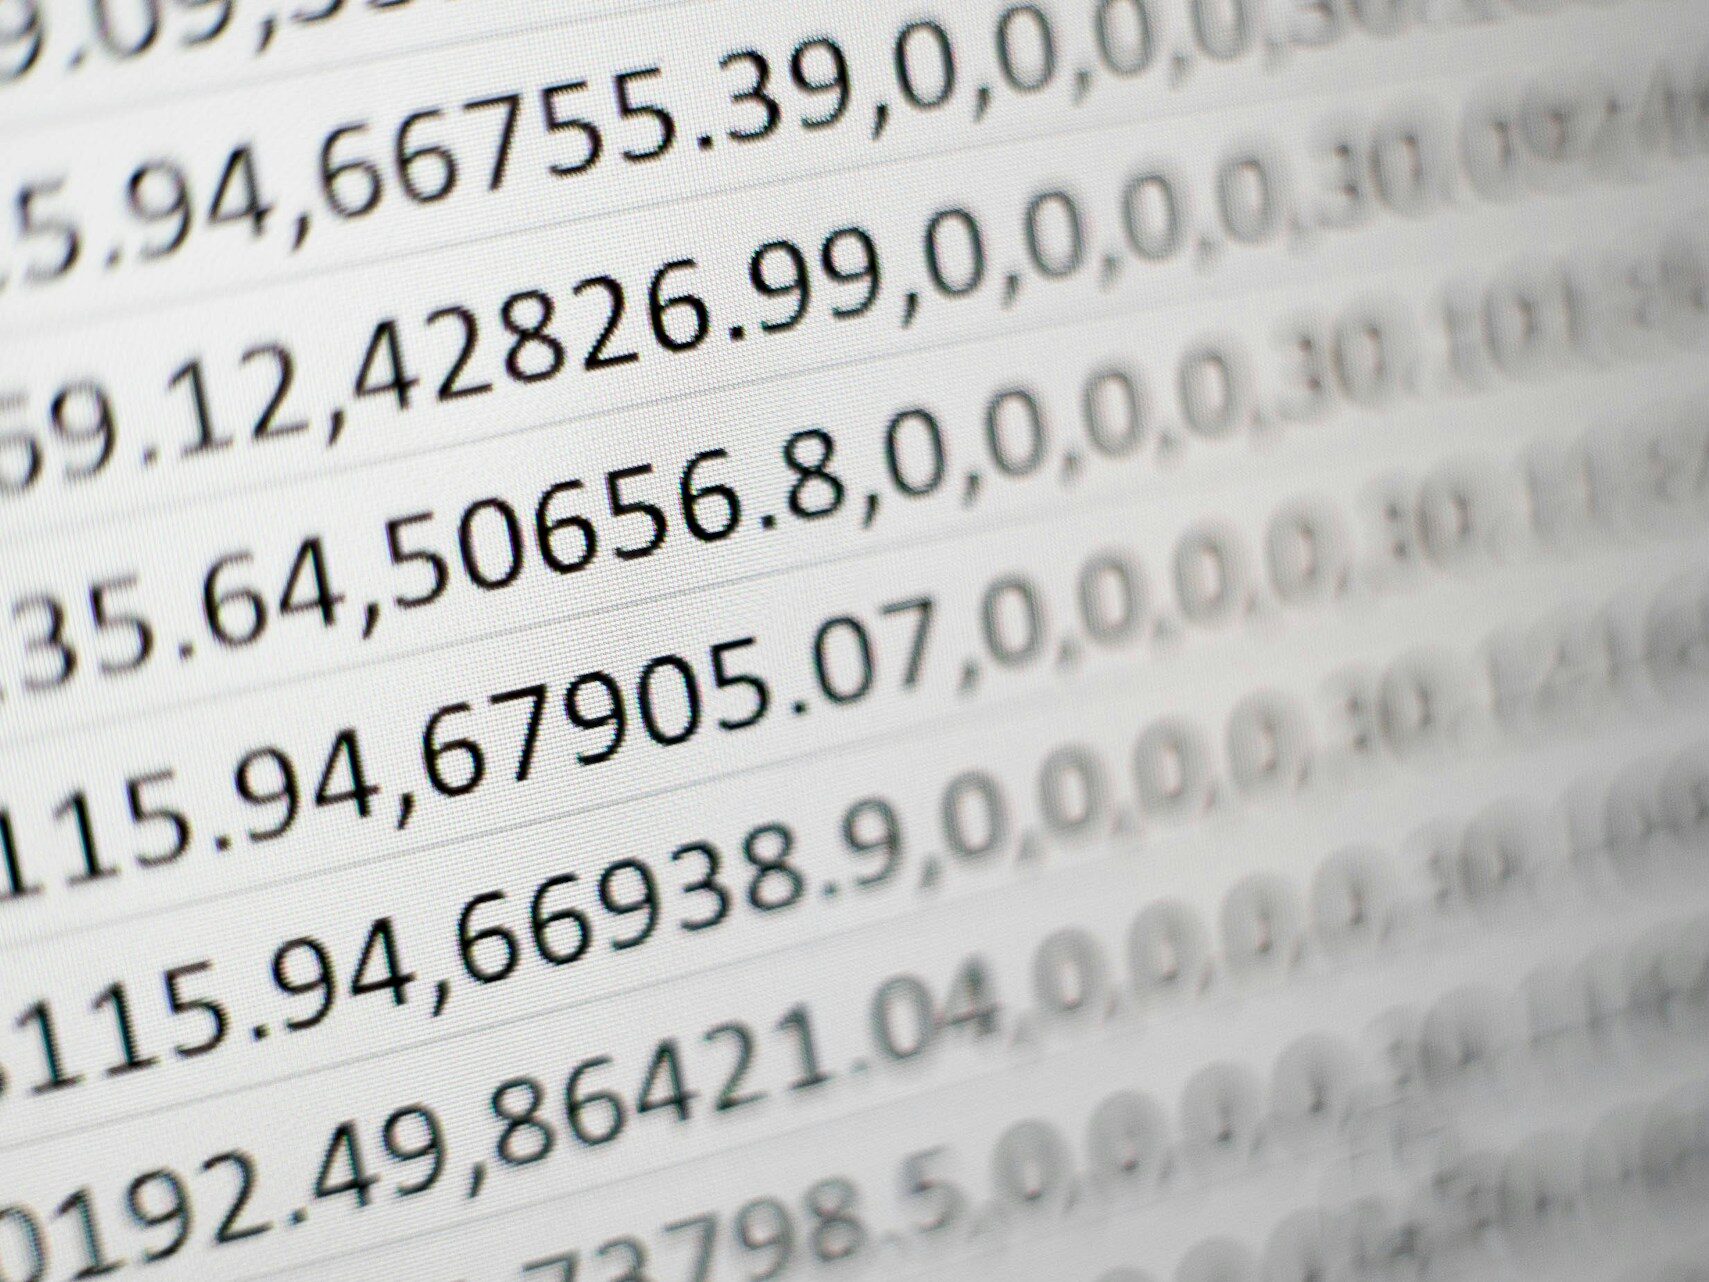
Image by Mika Baumeister via Unsplash
Basic data handling
Reading large datasets and creating the input files required by the models used at DLS, as well as reading the output files and collecting the results provided by the models.
Data analysis
Assess the quality of the input data used in the simulations is the first step to obtain good quality results.

Image by dimuthdezoysa via Pixabay

Image by tungnguyen0905 via Pixabay
Statistical analysis
Once the simulations are completed, R is often used to conduct a detailed analysis of the results provided by the simulation models.
Data visualization
R is the perfect tool to create detailed and informative visualizations of the model outputs for reports, presentations, and publications.
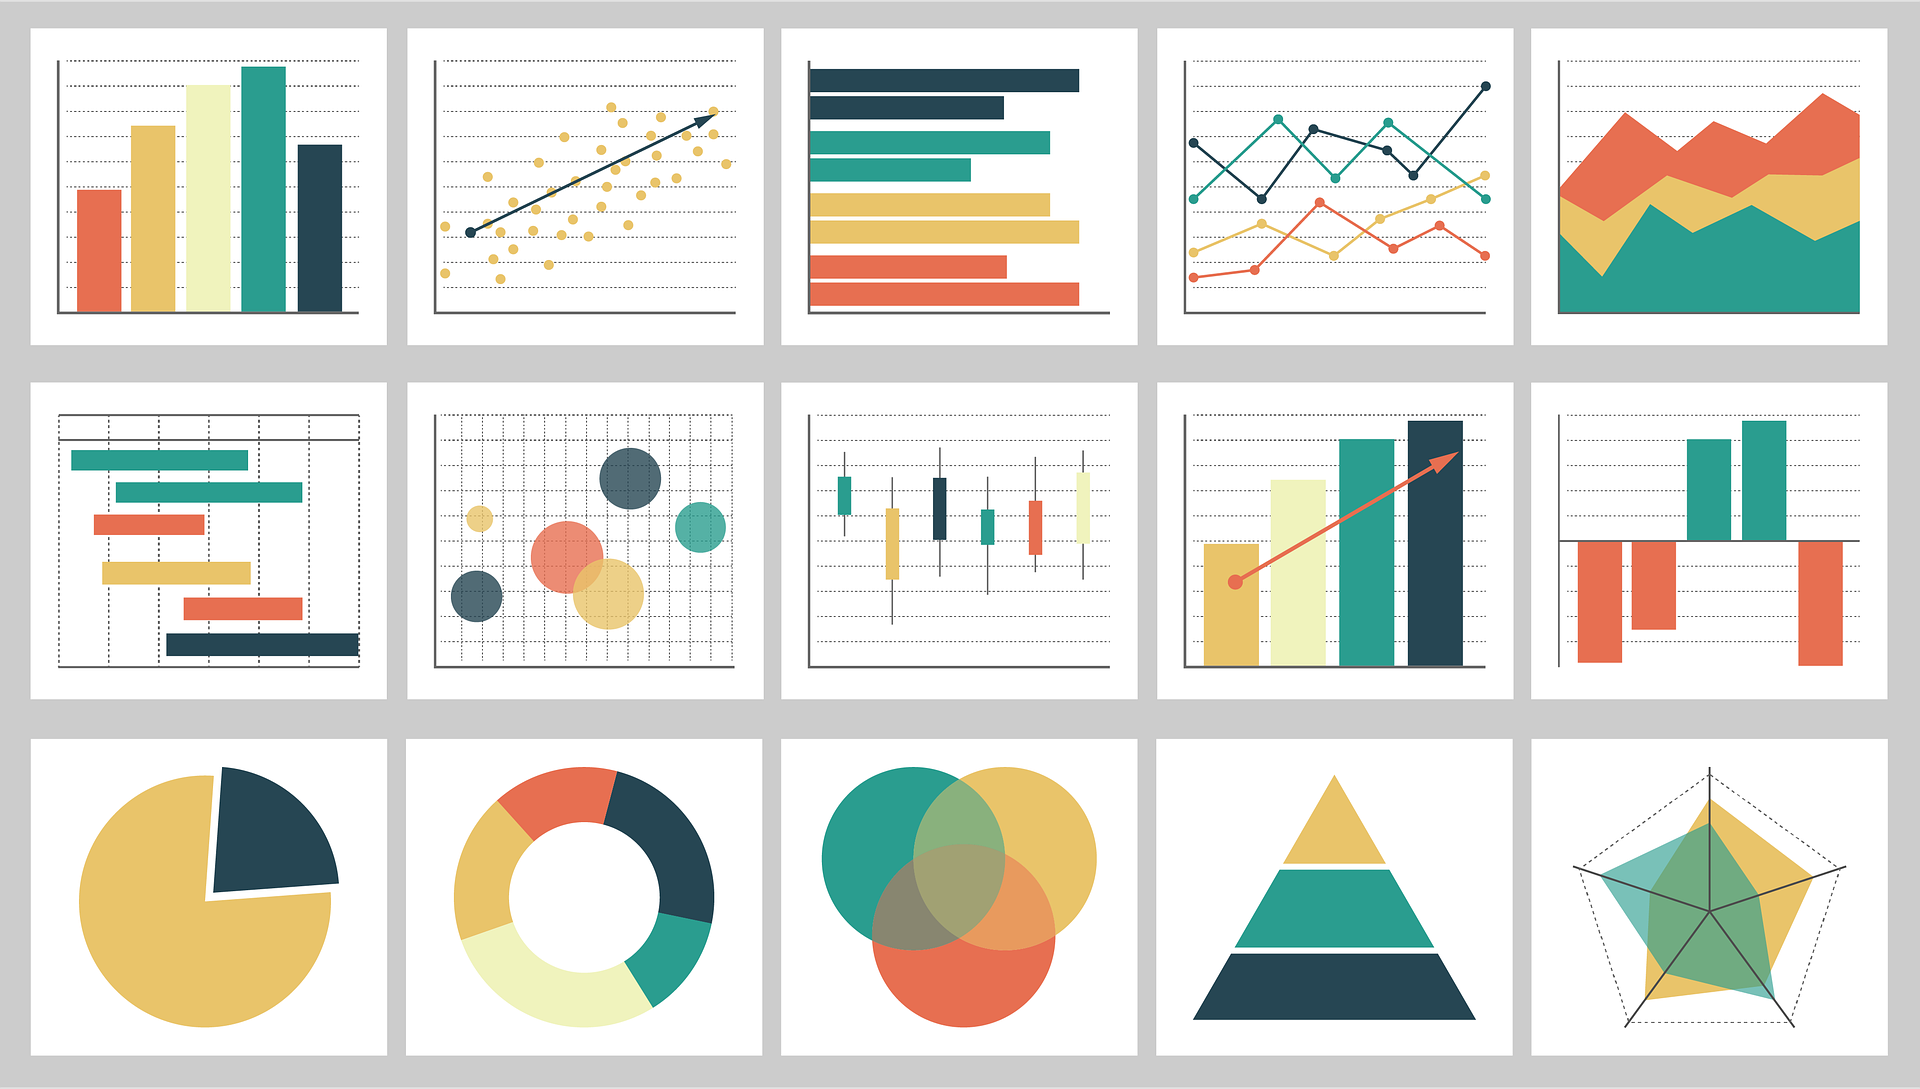
Image by Wallusy via Pixabay
More information about R are available here.